Continuously Optimize Your Website With Lighthouse CI

Performance has directly impacted the company’s bottom line. – Pinterest[1]
Intro
Since the development of the Internet, web page performance has always been an important issue. All major Internet companies are sparing no effort to optimize their web pages, in order to allow users to see the content that users want to see faster.
During the development of the Internet in recent decades, various indicators and terms for measuring web performance have stabilized, and the measurement methods of various products have tended to be consistent.
The BBC found that every 1 second increase in the load time of its website was associated with losing 10% more users. DoubleClick by Google found that 53% of mobile site visits are abandoned if a page takes longer than 3 seconds to load. DoubleClick by Google research shows that sites with loading times under 5 seconds experience 70% longer sessions, 35% lower bounce rates, and 25% higher ad viewability rates than sites that load about four times as long (19 seconds). Mobify saw a 1.11% increase in session-based conversions for every 100 milliseconds decrease in homepage load time and an average annual revenue increase of nearly $380,000. AutoAnything saw a 12-13% increase in sales after halving its page load time. It can be seen how important the performance of web pages is in today’s Internet of Everything era.
Problems with measuring web performance
Not runnable natively to catch performance issues as early as possible
Many tools cannot be run locally; if the web performance testing tools can be run locally, developers can find problems earlier and solve them locally as soon as possible, avoiding running on CI for a while before finding problems , which can save a lot of time and improve production efficiency in the agile development process of CI/CD. Shift-left of the web performance test is bound to bring more benefits to the performance of web products, and even more profits for the company.
Inability to continuously measure performance metrics
At present, most of the web performance measurement products on the market are Sass products. Using its products, we can only get a visual result page after running the performance test, but it cannot continuously record the improvement records of web page performance, and cannot be well quantified the life cycle of a web product performance. Of course there are also web performance testing tools that implement history, such as treo[2]
.
Cost
There are many open source free web performance testing tools, but they may not be so easy to use; if you need more features, such as continuous recording of web page performance, generally only commercial products will support it, and the fees are not low.
Difficulty with CI integration
As mentioned earlier, many tools either cannot be run locally or are Sass products, which cannot be well integrated with Pipeline, resulting in long feedback cycles of web performance results and make the engineering efficiency too low.
Lighthouse
Lighthouse is an open-source, automated tool for improving the quality of web pages. You can run it against any web page, public or requiring authentication. It has audits for performance, accessibility, progressive web apps, SEO and more.
You can run Lighthouse in
Chrome DevTools, from the command line, or as aNodemodule. You giveLighthousea URL to audit, it runs a series of audits against the page, and then it generates a report on how well the page did. From there, use the failing audits as indicators on how to improve the page. Each audit has a reference doc explaining why the audit is important, as well as how to fix it.
You can also use Lighthouse CI to prevent regressions on your sites.
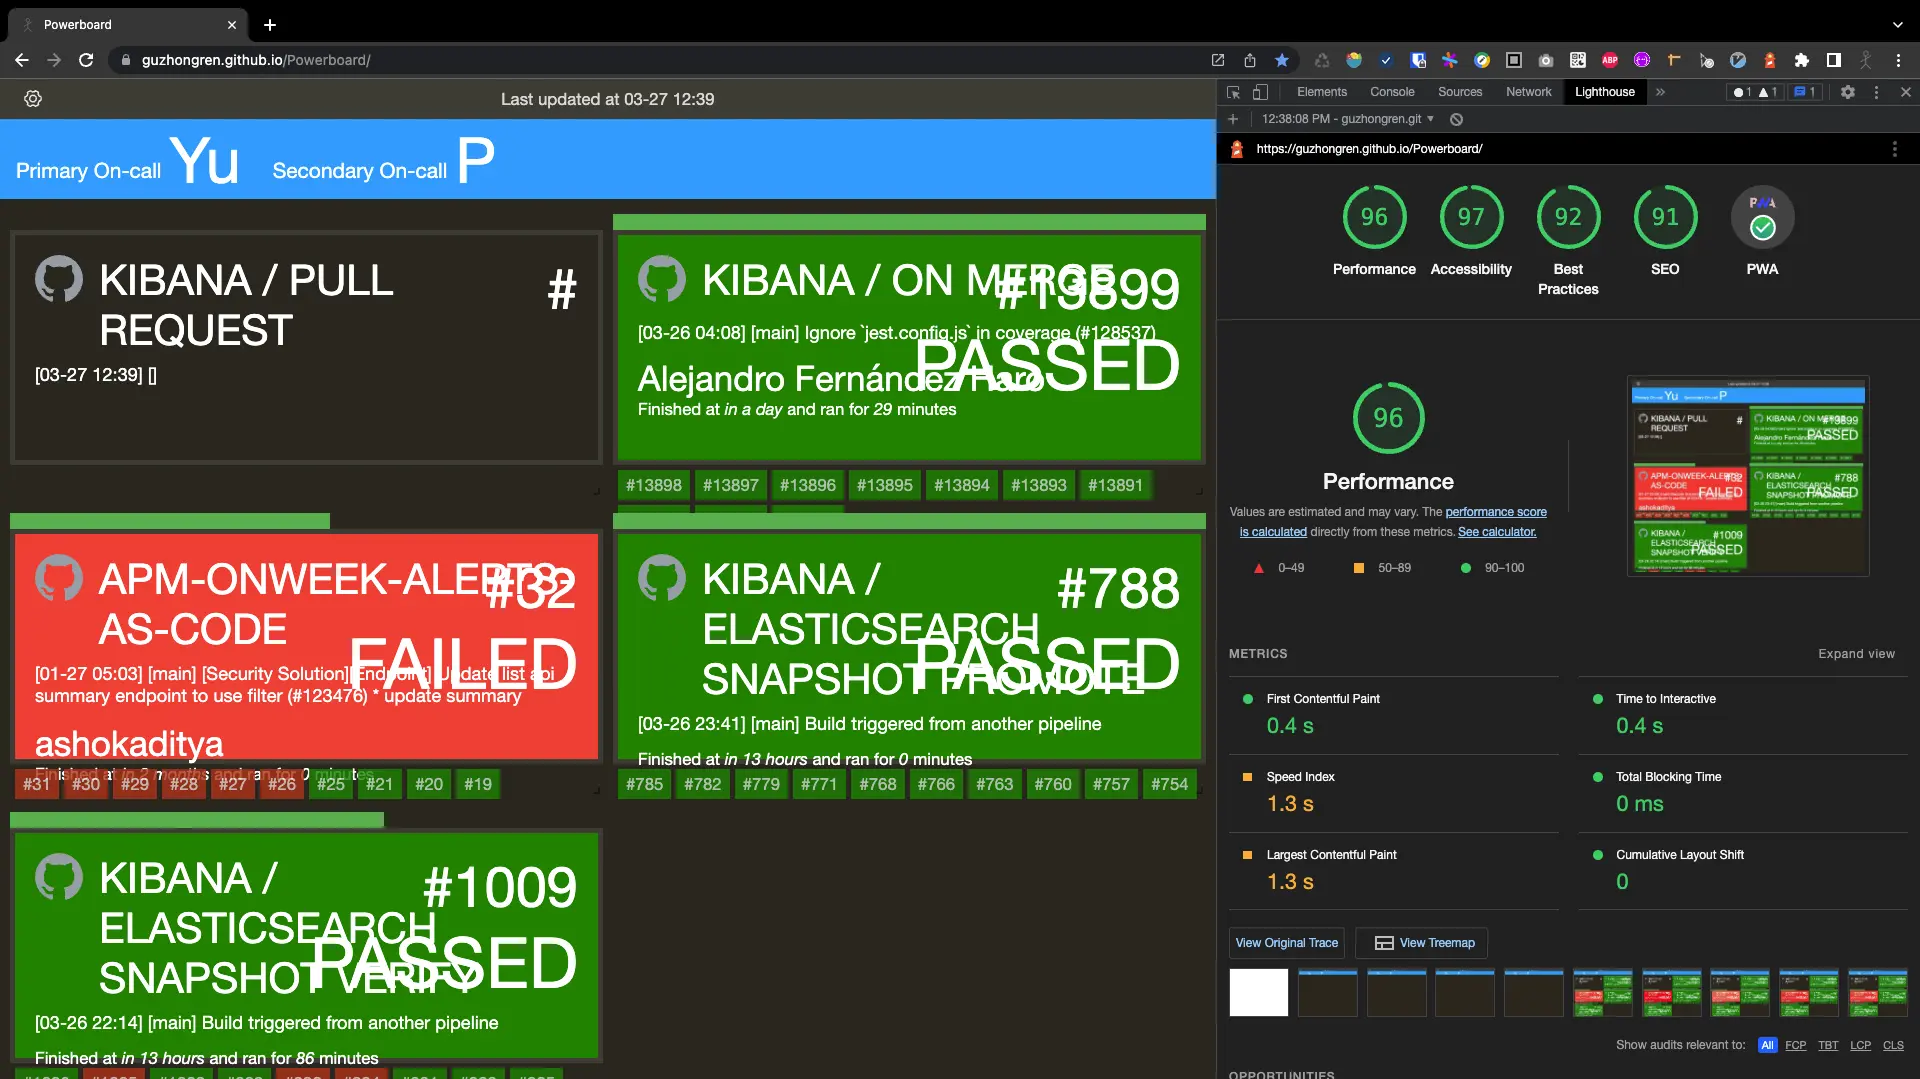
It’s very easy to use, take a look at the results of my audit of my open source project Powerboard[3]
.

Ways of Lighthouse CI and Lighthouse Server
Lighthouse CI (LHCI)
Automate running Lighthouse for every commit, viewing the changes, and preventing regressions – GoogleChrome/lighthouse-ci[4]
Lighthouse CI is a suite of tools that make continuously running, saving, retrieving, and asserting against Lighthouse results as easy as possible.
How to use
LHCI provides the npm installation package, which can be well integrated on the Pipeline, just run the autorun command in the corresponding directory, the command is as follows
npm install -g @lhci/cli
lhci autorun
After the operation is completed, LHCI will store the results in the .lighthouseci directory, and you can open the corresponding report with a browser.
Lighthouse Server
The LHCI server saves historical Lighthouse data, displays trends in a dashboard, and offers an in-depth build comparison UI to uncover differences between builds.
 |  |
|---|
Installation and use of LHCI Server
There are many ways to install LHCI Server, please refer to here[5]
, the recommended way is to use Docker. Note that the first run needs to create a Lighthouse App, you need to run the lhci wizard in the container and fill in the corresponding information, finally record the generated Build token and Admin token.
Integration with Lighthouse CI and Lighthouse Server

- We have already talked about how to install
lhciandlhci server, the next step is to use the two together. Here we takeGitHub Actionsas an example to make a demo. - Build
GitHub workflow. For specific practices, please refer to the implementation details of Powerboard[3] - .github/workflows/Lighthouse.yml
name: Lighthouse CI
on:
  push:
    branches:
      - main
jobs:
  lhci:
    name: Lighthouse
    runs-on: ubuntu-latest
    steps:
      - uses: actions/checkout@v2
        with:
          ref: ${{ github.event.pull_request.head.sha }}
      - name: Use Node.js 10.x
        uses: actions/setup-node@v1
        with:
          node-version: 16.14.2
      - name: npm install, build
        run: |
          npm install
          npm run build
      - name: Upload Lighthouse Report
        run: |
          npm install -g @lhci/cli
          lhci autorun --config=.github/config/lighthouserc-no-condition.json
          lhci upload --serverBaseUrl=${{ secrets.LHCI_SERVER_URL }} --token=${{ secrets.LHCI_BUILD_TOKEN }}
        env:
          LHCI_GITHUB_APP_TOKEN: ${{ secrets.LHCI_GITHUB_APP_TOKEN }}
      - name: Check Lighthouse Report
        run: |
lhci autorun --config=.github/config/lighthouserc.json- .github/config/lighthouserc-no-condition.json
{
  "ci": {
    "collect": {
      "staticDistDir": "./dist",
      "settings": {
        "formFactor": "desktop",
        "screenEmulation": {
          "mobile": false,
          "width": 1920,
          "height": 1080,
          "deviceScaleFactor": 1,
          "disabled": false
        }
      }
    },
    "assert": {
      "assertions": {
        "categories:performance": "off",
        "categories:accessibility": "off",
        "categories:best-practices": "off",
        "categories:seo": "off",
        "categories:pwa": "off"
      }
    }
  }
}- .github/config/lighthouserc.json
{
  "ci": {
    "collect": {
      "staticDistDir": "./dist",
      "settings": {
        "formFactor": "desktop",
        "screenEmulation": {
          "mobile": false,
          "width": 1920,
          "height": 1080,
          "deviceScaleFactor": 1,
          "disabled": false
        }
      }
    },
    "assert": {
      "assertions": {
        "categories:performance": ["error", { "minScore": 0.8 }],
        "categories:accessibility": ["error", { "minScore": 0.95 }],
        "categories:best-practices": ["error", { "minScore": 1 }],
        "categories:seo": ["error", { "minScore": 0.9 }],
        "categories:pwa": ["warn", { "minScore": 0.99 }]
      }
    }
  }
}- Need to store the
Build tokengenerated bylhci Serverand the address oflhci Serverin the Secrets of the GitHub project - Here the
lhcicommand is executed twice. Becauselhci autorunruns the defaultassertion, the first time you use the command without assertion, the purpose is to upload the current web page performance to the server side; the second time you configure various indicators Threshold, if it does not meet the requirements, Pipeline will block, to achieveShift-left of the web performance test. 
Summary
- For: Developers, technical leads or marketers
- They want to:
continuously quantifyand demonstrate theperformanceof web pages - This: Lighthouse CI
- is one: a set of tools written by
Googleto make it as easy as possible to continuously run, save, retrieve, and assert onLighthouseresults. It can evaluate web applications and pages, as well as gather information such as performance metrics and insights from development best practices - It can: test your web page, get web page’s
Performance,Accessibility,Best Practices,SEOandPWAscores on differentdevices, these scores can be used to analyze the product performance, helping to improve user conversion rates, etc. - Unlike: treo[2] or some other web performance testing tool
- Its advantages are:
Open-Source,Free,Self-hosteddata and Server,Easy to integrate.
参考
- Pinterest: https://www.youtube.com/watch?v=Xryhxi45Q5M&feature=youtu.be&t=1366
- treo: https://treo.sh/
- Powerboard: https://github.com/guzhongren/Powerboard
- GoogleChrome/lighthouse-ci: https://github.com/GoogleChrome/lighthouse-ci
- here: https://github.com/GoogleChrome/lighthouse-ci/blob/main/docs/server.md#lhci-server
免责声明
本文仅代表个人观点,与本人所供职的公司无任何关系。
